Analysis
Measuring distances
Gromacs can also measure all kinds of distances between atoms and atom groups for the trajectory.
Distances between atoms
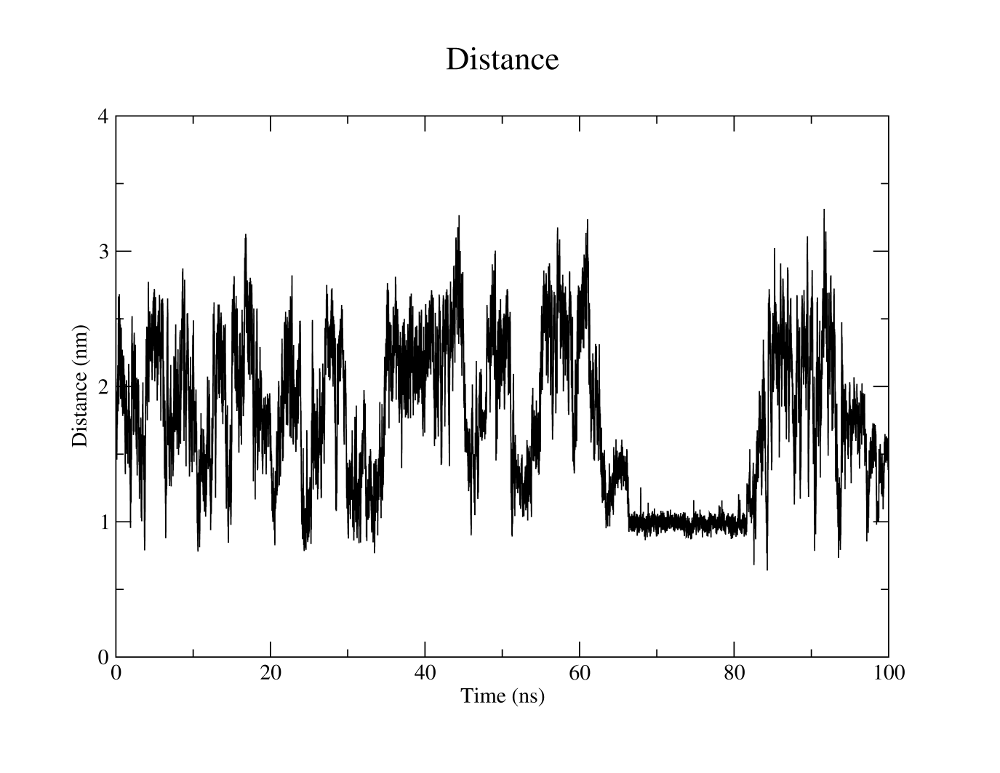
As an example, we are interested in how the distance between the Cα atoms of the N- and C-terminal residues evolves with time. Gromacs needs to know the indices of these atoms in the trajectory. These residues have the indices 1 and 18. We can create a new group containing these atoms withgmx make_ndx, selecting the intersection of the group that
contains only Cα atoms (group 3)
with the group that contains only atoms of residues 1 and 18.
You can save this selection in the previously specified file NC_distance.ndx. Now we can use the newly defined group to plot the distance of these two atoms versus time. This is done with the tool
distance:
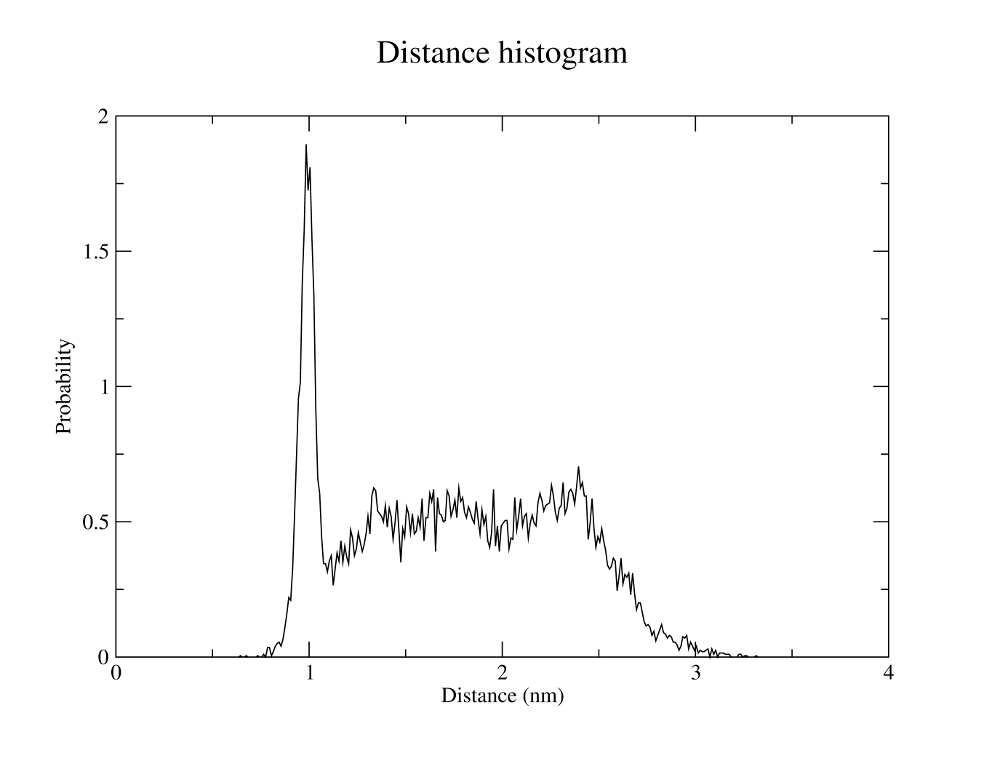
gmx distance -f md_protein.xtc -s md_protein.tpr -oall NC_dist.xvg -oh NC_disthist.xvg -n NC_distance.ndx -tu ns -len 2 -binw 0.01
-tu ns, in this case nanoseconds.
The -len and -binw arguments specify the center of the histogram and the width of the bins.
Both output files can be viewed with xmgrace.
Your outputs should look similar to the plots to the right.
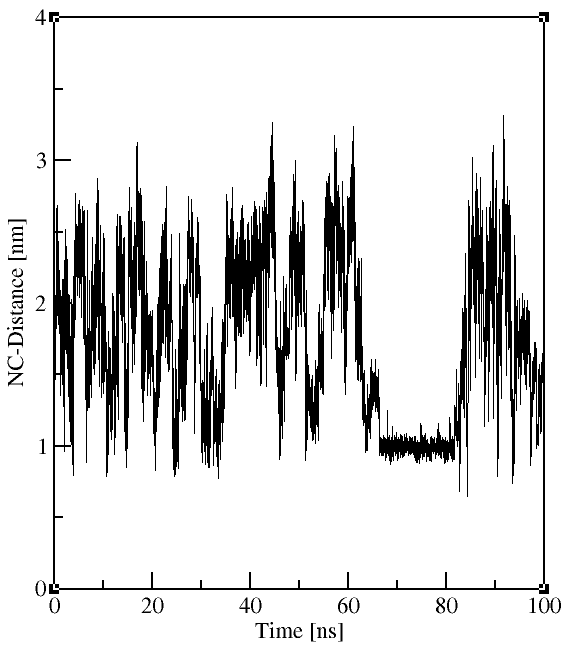
Minimum distances between atom groups
One calculates the minimum distance between two groups of atoms if one is interested in how close two atom groups, e.g. two amino acid residues approach in the course of the simulation. If not existent, the required groups first have to be created and saved in the index file. The minimum distance between these two groups can then be calculated withgmx mindist:
gmx mindist -f md_protein.xtc -s md_protein.tpr -od min_NC_dist.xvg -n NC_distance.ndx -tu ns
Distance and contact maps
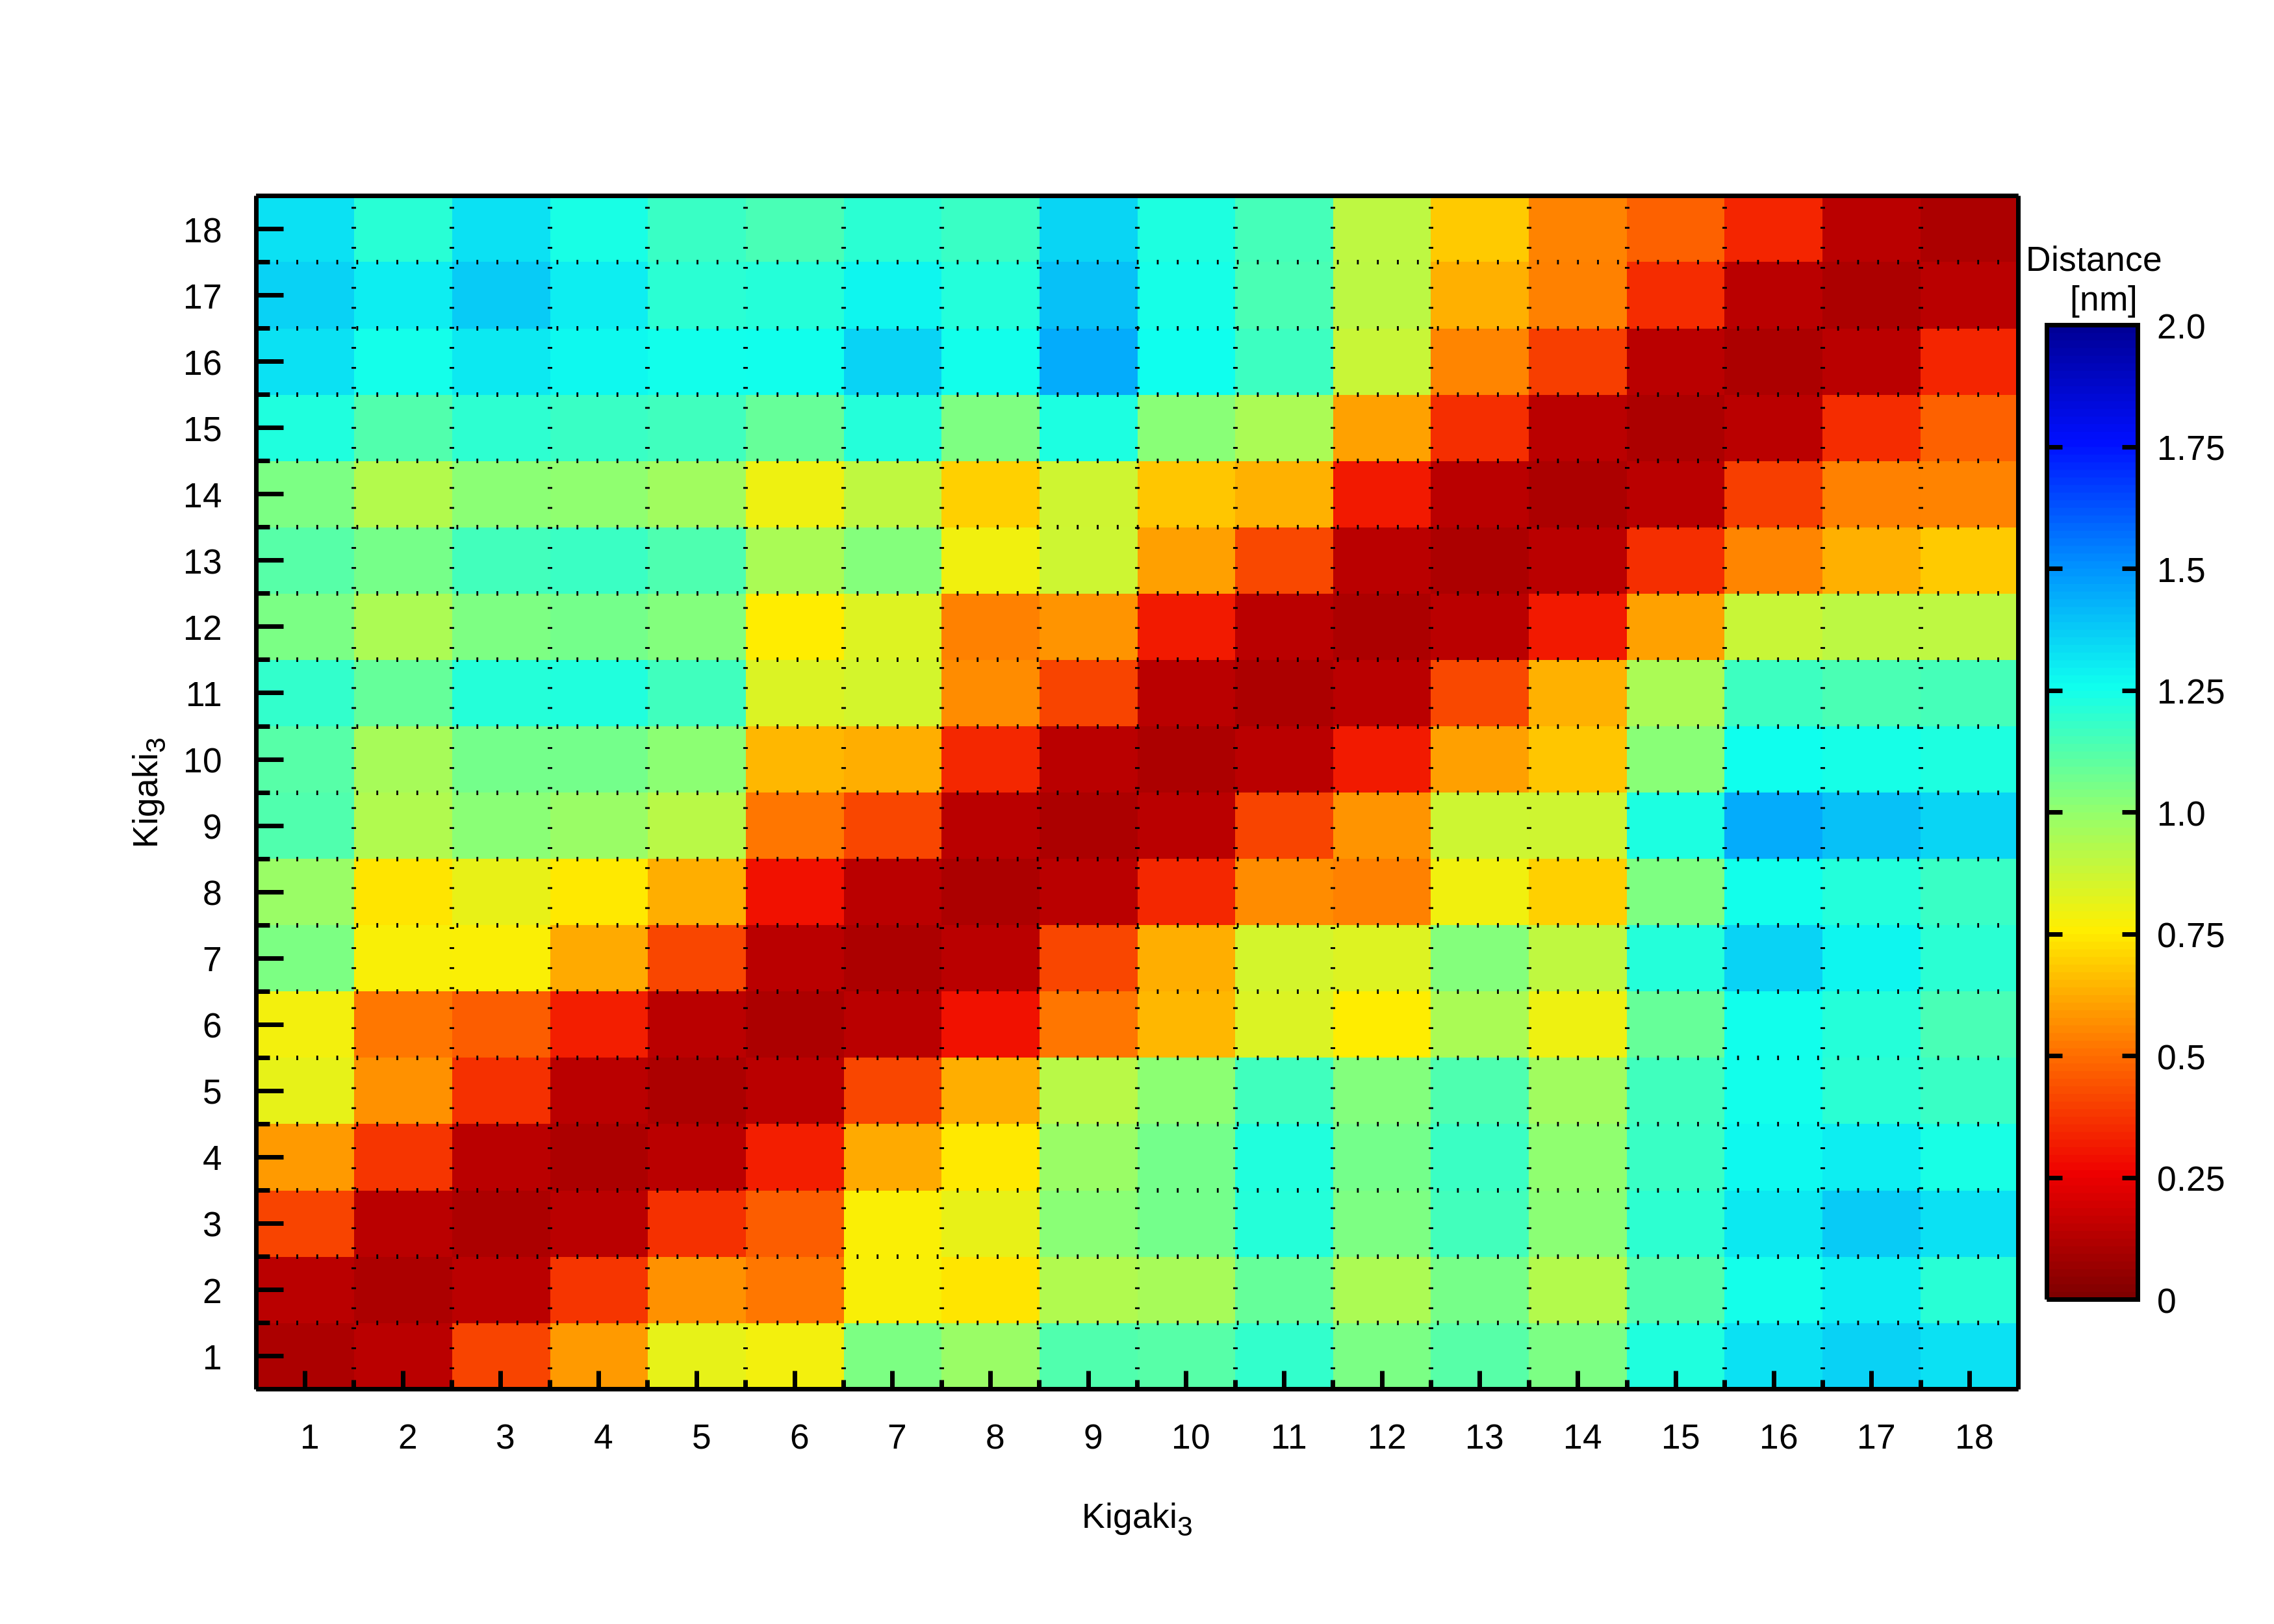
A protein distance represents the average distance between all possible amino acid residue pairs using a two-dimensional matrix representation. A contact map shows the corresponding contact probability where two residues i and j are considered to be in contact when they are closer than a predetermined threshold. For each snapshot of a trajectory it is checked whether i and j are in contact with each other or not, and the time-averaged probability is then being calculated.Here, we will calculate the distance map using the bash script distancemap.sh, which is invoked via the command line together with the required arguments (see below). This script calls
gmx mindist for each residue pair i, j, which generates the time evolution of the minimum
distance (see above) and from which the average distance between i and j is calculated.
This data is saved in distancemap.dat, which is then plotted with
gnuplot using the file distancemap.gnu that is automatically produced by the
script distancemap.sh. Output is the bitmap file distancemap.png as shown
on the right.
The script is called as follows:
./distancemap.sh <traj_file> <tpr_file> <index_file> <mol1-start> <mol1-end> <mol2-start> <mol2-end> <dt> <gnu_x_label> <gnu_y_label>
traj_file = trajectory file (*.xtc, *.trr)
tpr_file = (*.tpr, *.pdb, *.gro)
index_file = index file containing the resdiue groups (groups should start with number 1)
mol1/2-start = number of the first group of molecule 1/2
mol1/2-end = number of the last group of molecule 1/2
dt = time step between frames to be considered (in ps)
gnu_x/y_label = x/y label for the final plot
./distancemap.sh md_protein.xtc md_protein.tpr res.ndx 1 18 1 18 1000 Kigaki_3 Kigaki_3 >& distancemap.log &
res.ndx via gmx make_ndx -f md_protein.pdb -o res.ndx,
enter following commands:
splitres 1 (to split the protein into its residues, generating groups 10-28)
del 1-9 (to delete all standard groups)